Everyone loves pretty graphs but these contain important information.
Trend Report
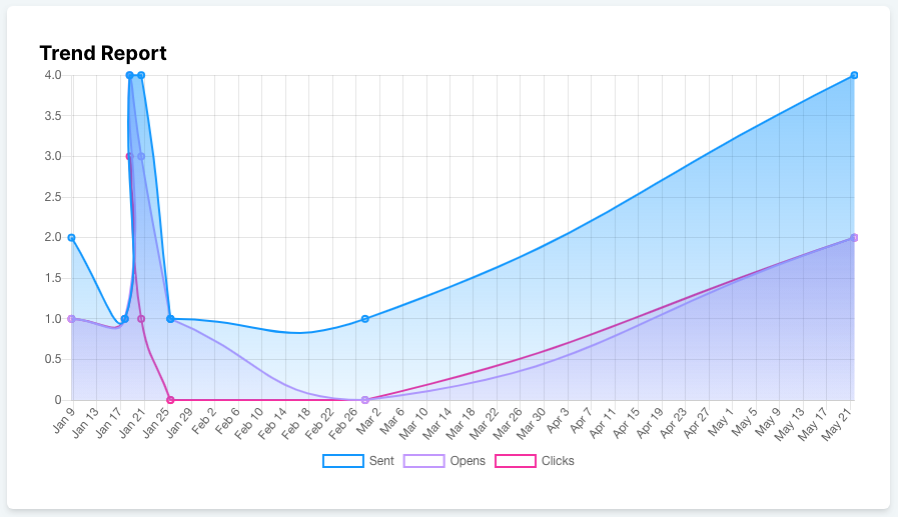
Based on the date range selected in the dashboard, you'll see metrics for each of your mailings charted on the line graph. Here you can identify any issues or anomalies in your mailings.
The metrics shown are:
- Sent - number of recipients per mailing
- Opens - unique opens per mailing
- Clicks - unique clicks per mailing
You can also click a metric to disable it from being shown on the graph.
Comments
0 comments
Please sign in to leave a comment.